What Do You Owe Society? Building an Honest Lifetime Contribution Calculator
A calculator that weighs what society spent on you against what you gave back, year by year, with every assumption on show and no data kept.
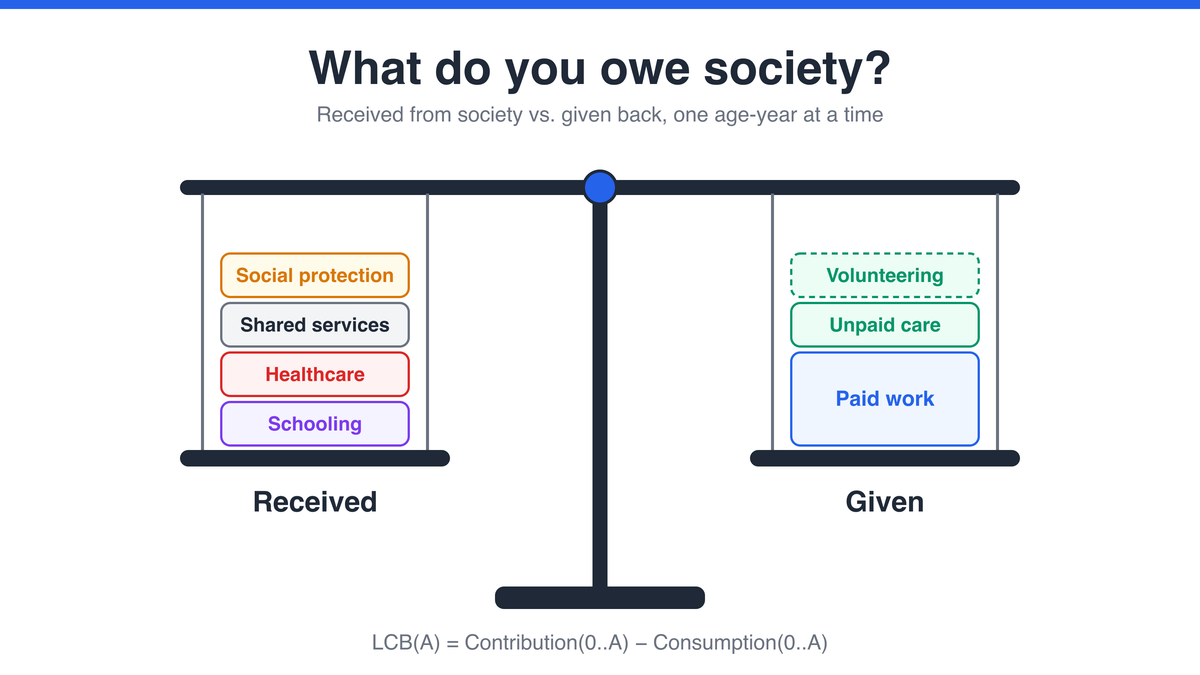
LCB(A) = Contribution(0..A) − Consumption(0..A). The engine applies it to every year of a life, using published national statistics.Every number comes from a versioned "coefficient pack". Each one carries its source, its year and a label saying how it was obtained, and every result shows an honest range, not a single falsely precise figure.There is no database. Your answers stay in the browser, and the API is a pure function. The tool also says in plain words that it must never be used to make decisions about people.The dinner-table question nobody can answer
Sooner or later, at most dinner tables, someone says it. "I've paid in my whole life and got nothing back." Or the darker version: "People like them just take." Everyone has an opinion. Nobody has a number.
I kept wondering about the honest version of that question, asked of myself. Since the day I was born, I have been given a lot: years of school, doctors, roads, streetlights, a safety net I may never have noticed. I have also given back through work, through looking after people, and through the odd Saturday helping out. How do the two actually compare?
It turns out you can estimate this. Governments publish what they spend per student, per patient and per person. Statistics offices publish how much an hour of work produces. What was missing was something that puts it all together for one life, shows its working, and refuses to pretend to be more certain than it is.
What I built
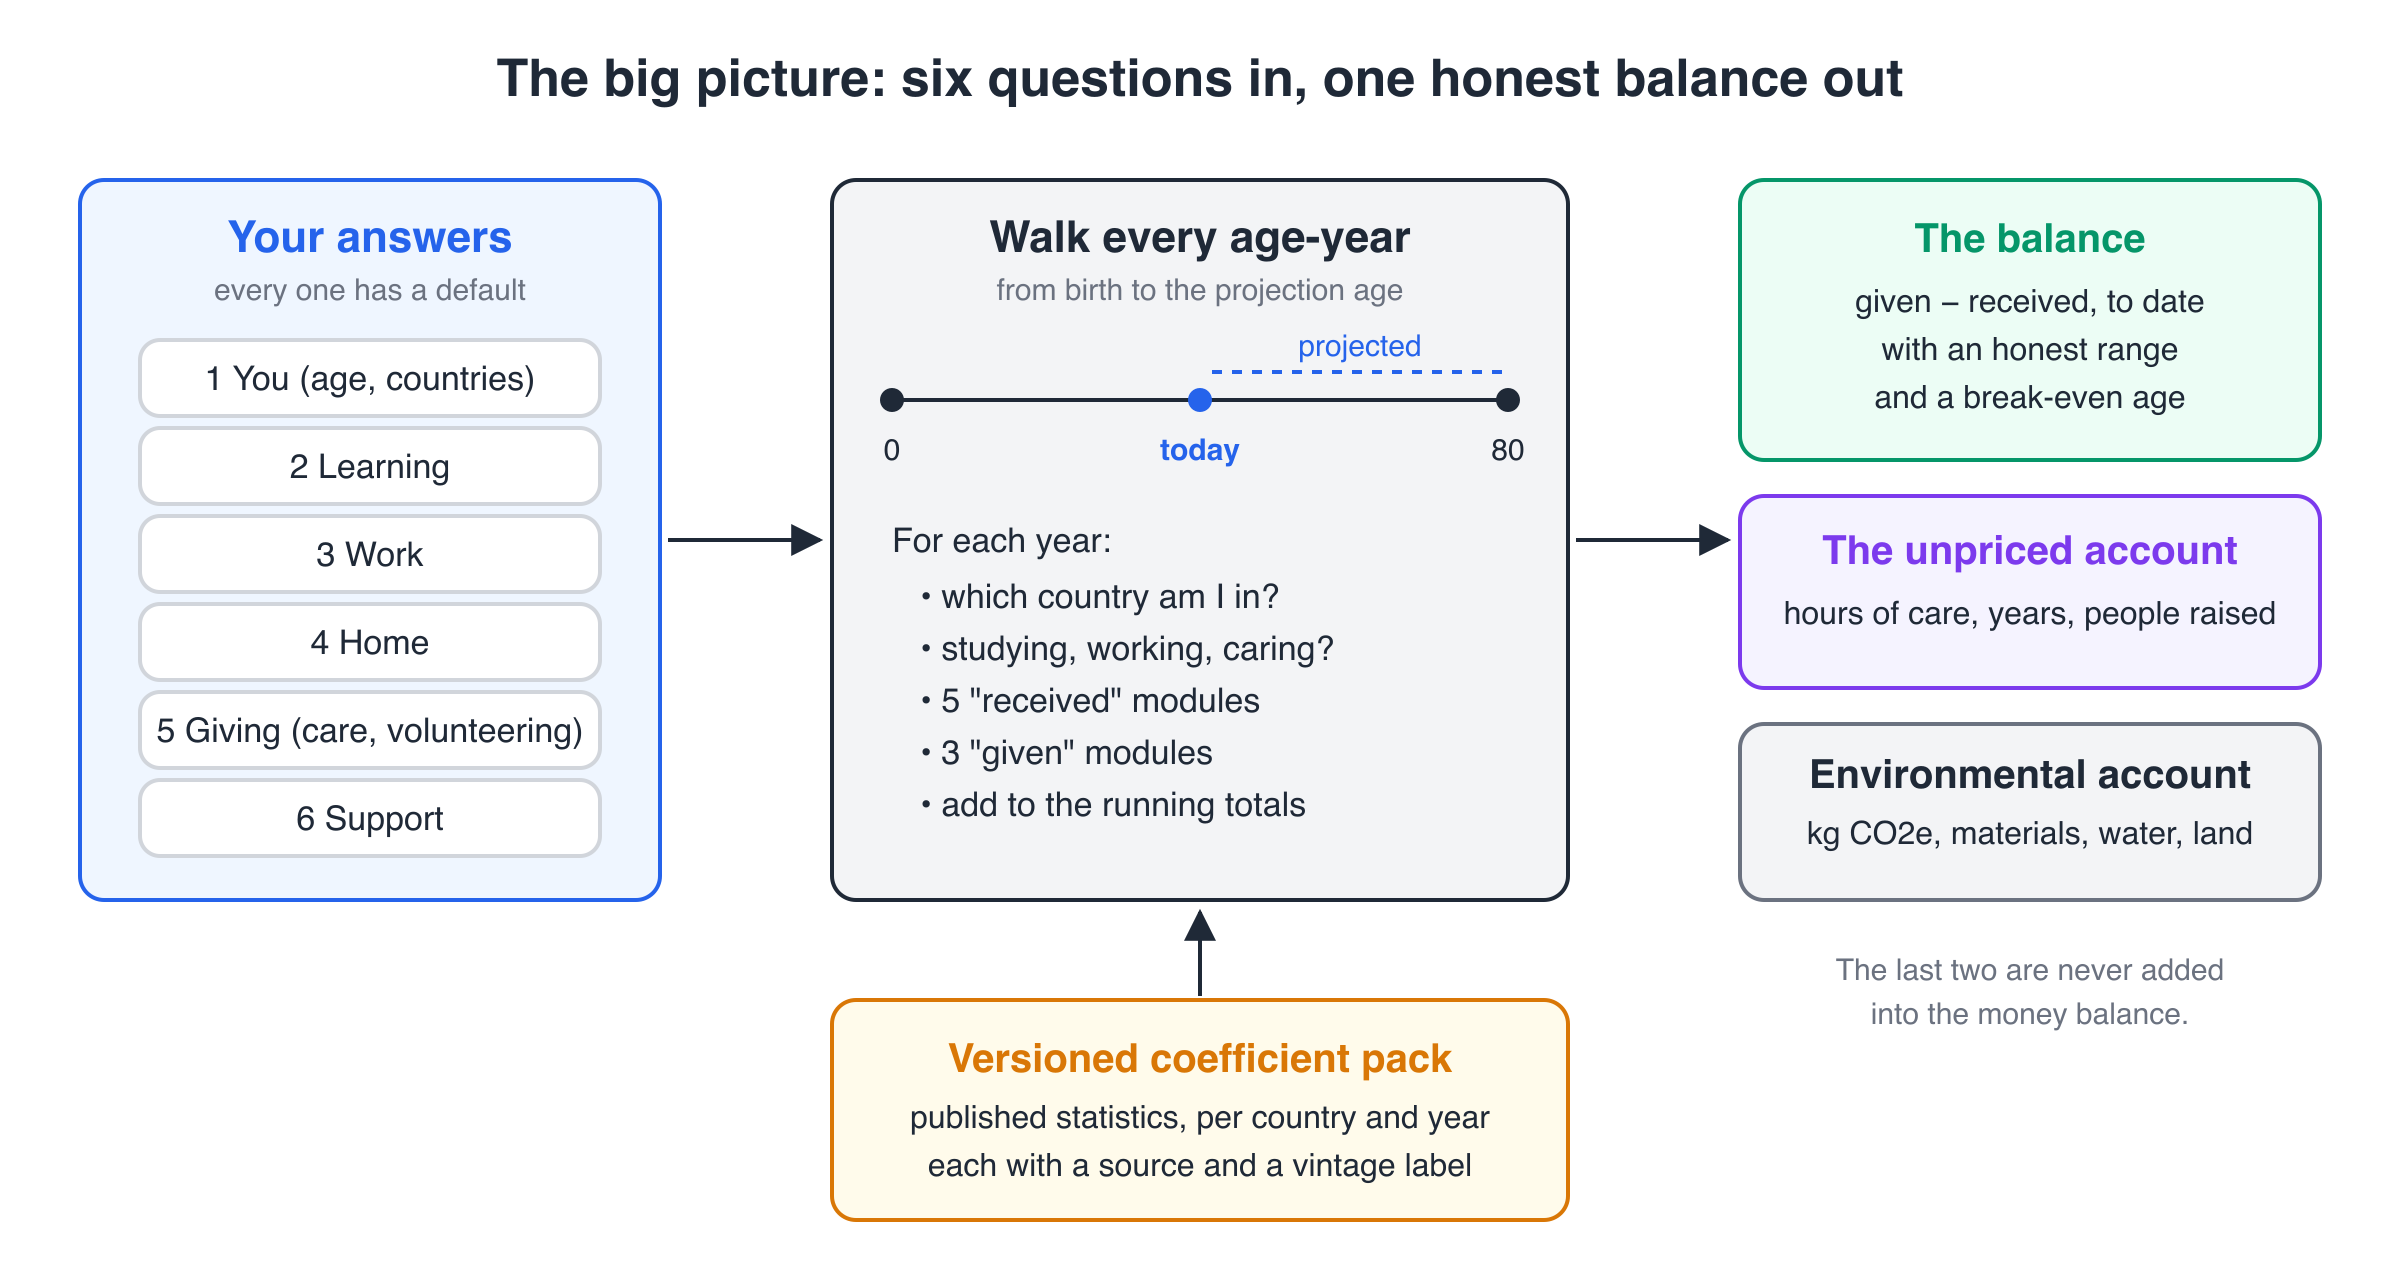
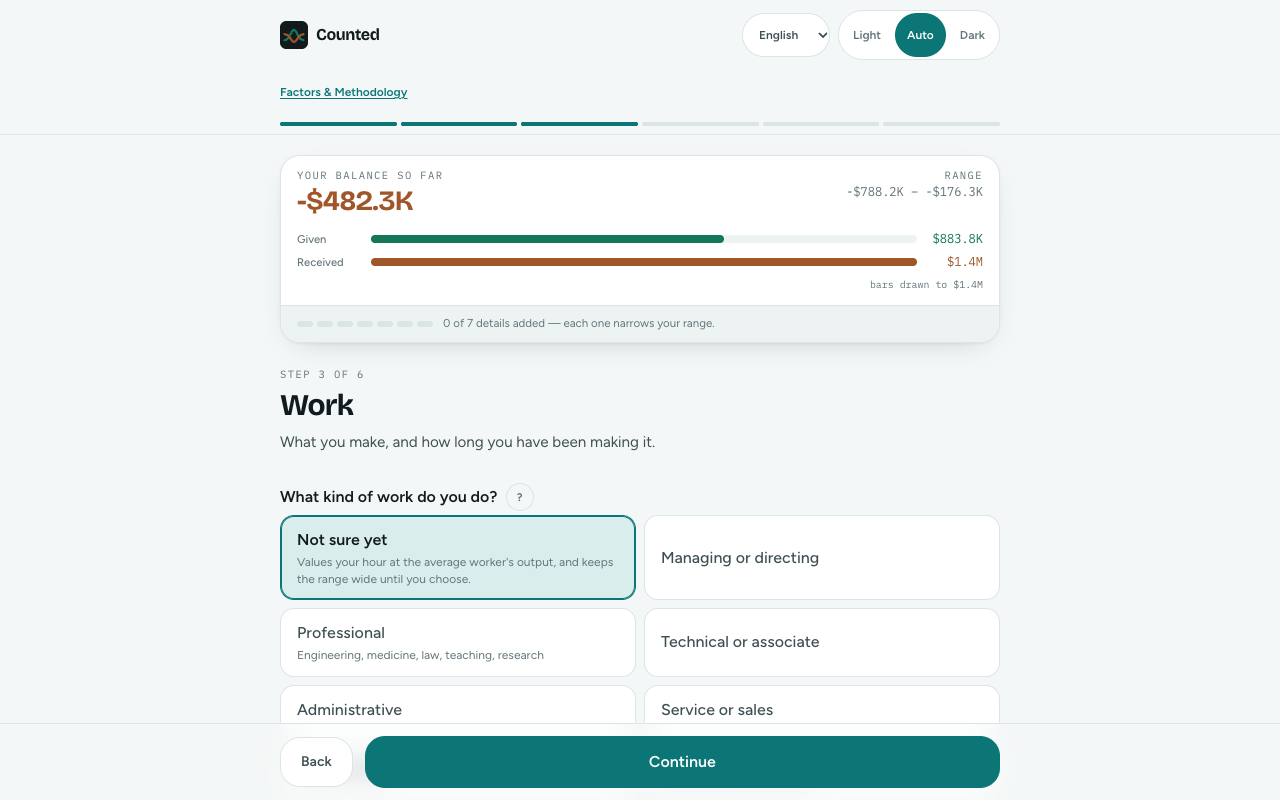
Lifetime Contribution Balance is a small web app with a calculation engine behind it. You answer six short steps (You, Learning, Work, Home, Giving, Support), and every question has a sensible default, so you can skip any of them. The engine walks through your life one age-year at a time and returns a balance to date, an honest range around it, a break-even age, and two extra accounts that are deliberately never folded into the money.
The welcome screen sets the tone before you answer anything: "Not a score of your worth. Not a test you pass." That line shaped almost every design decision that came later.
The model in one line
Here is the whole idea:
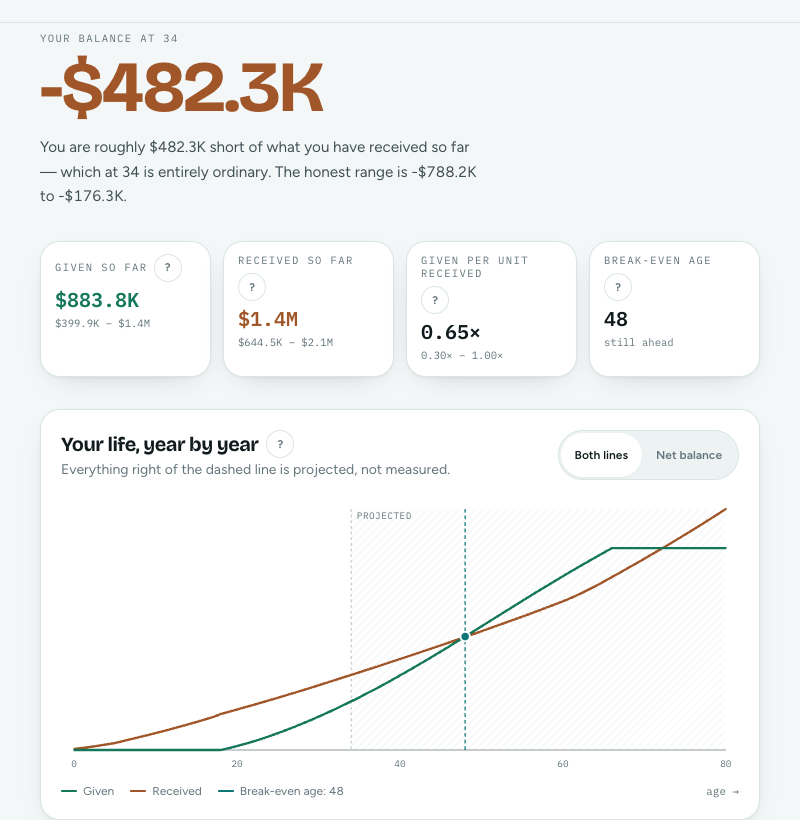
LCB(A) = Contribution(0..A) − Consumption(0..A)In plain words: add up everything you have given from birth to age A, subtract everything you have received, and the gap is your balance at A. Think of a bank statement for your relationship with society, with one row per year of your life.
The engine builds that statement literally. It turns your answers into a timeline with one slice per age-year. For each slice it asks where you lived, which calendar year it was, and whether you were studying, working, caring or retired. It then runs eight "modules" and adds up the results. Years after today use projected figures plus your own retirement and salary assumptions.
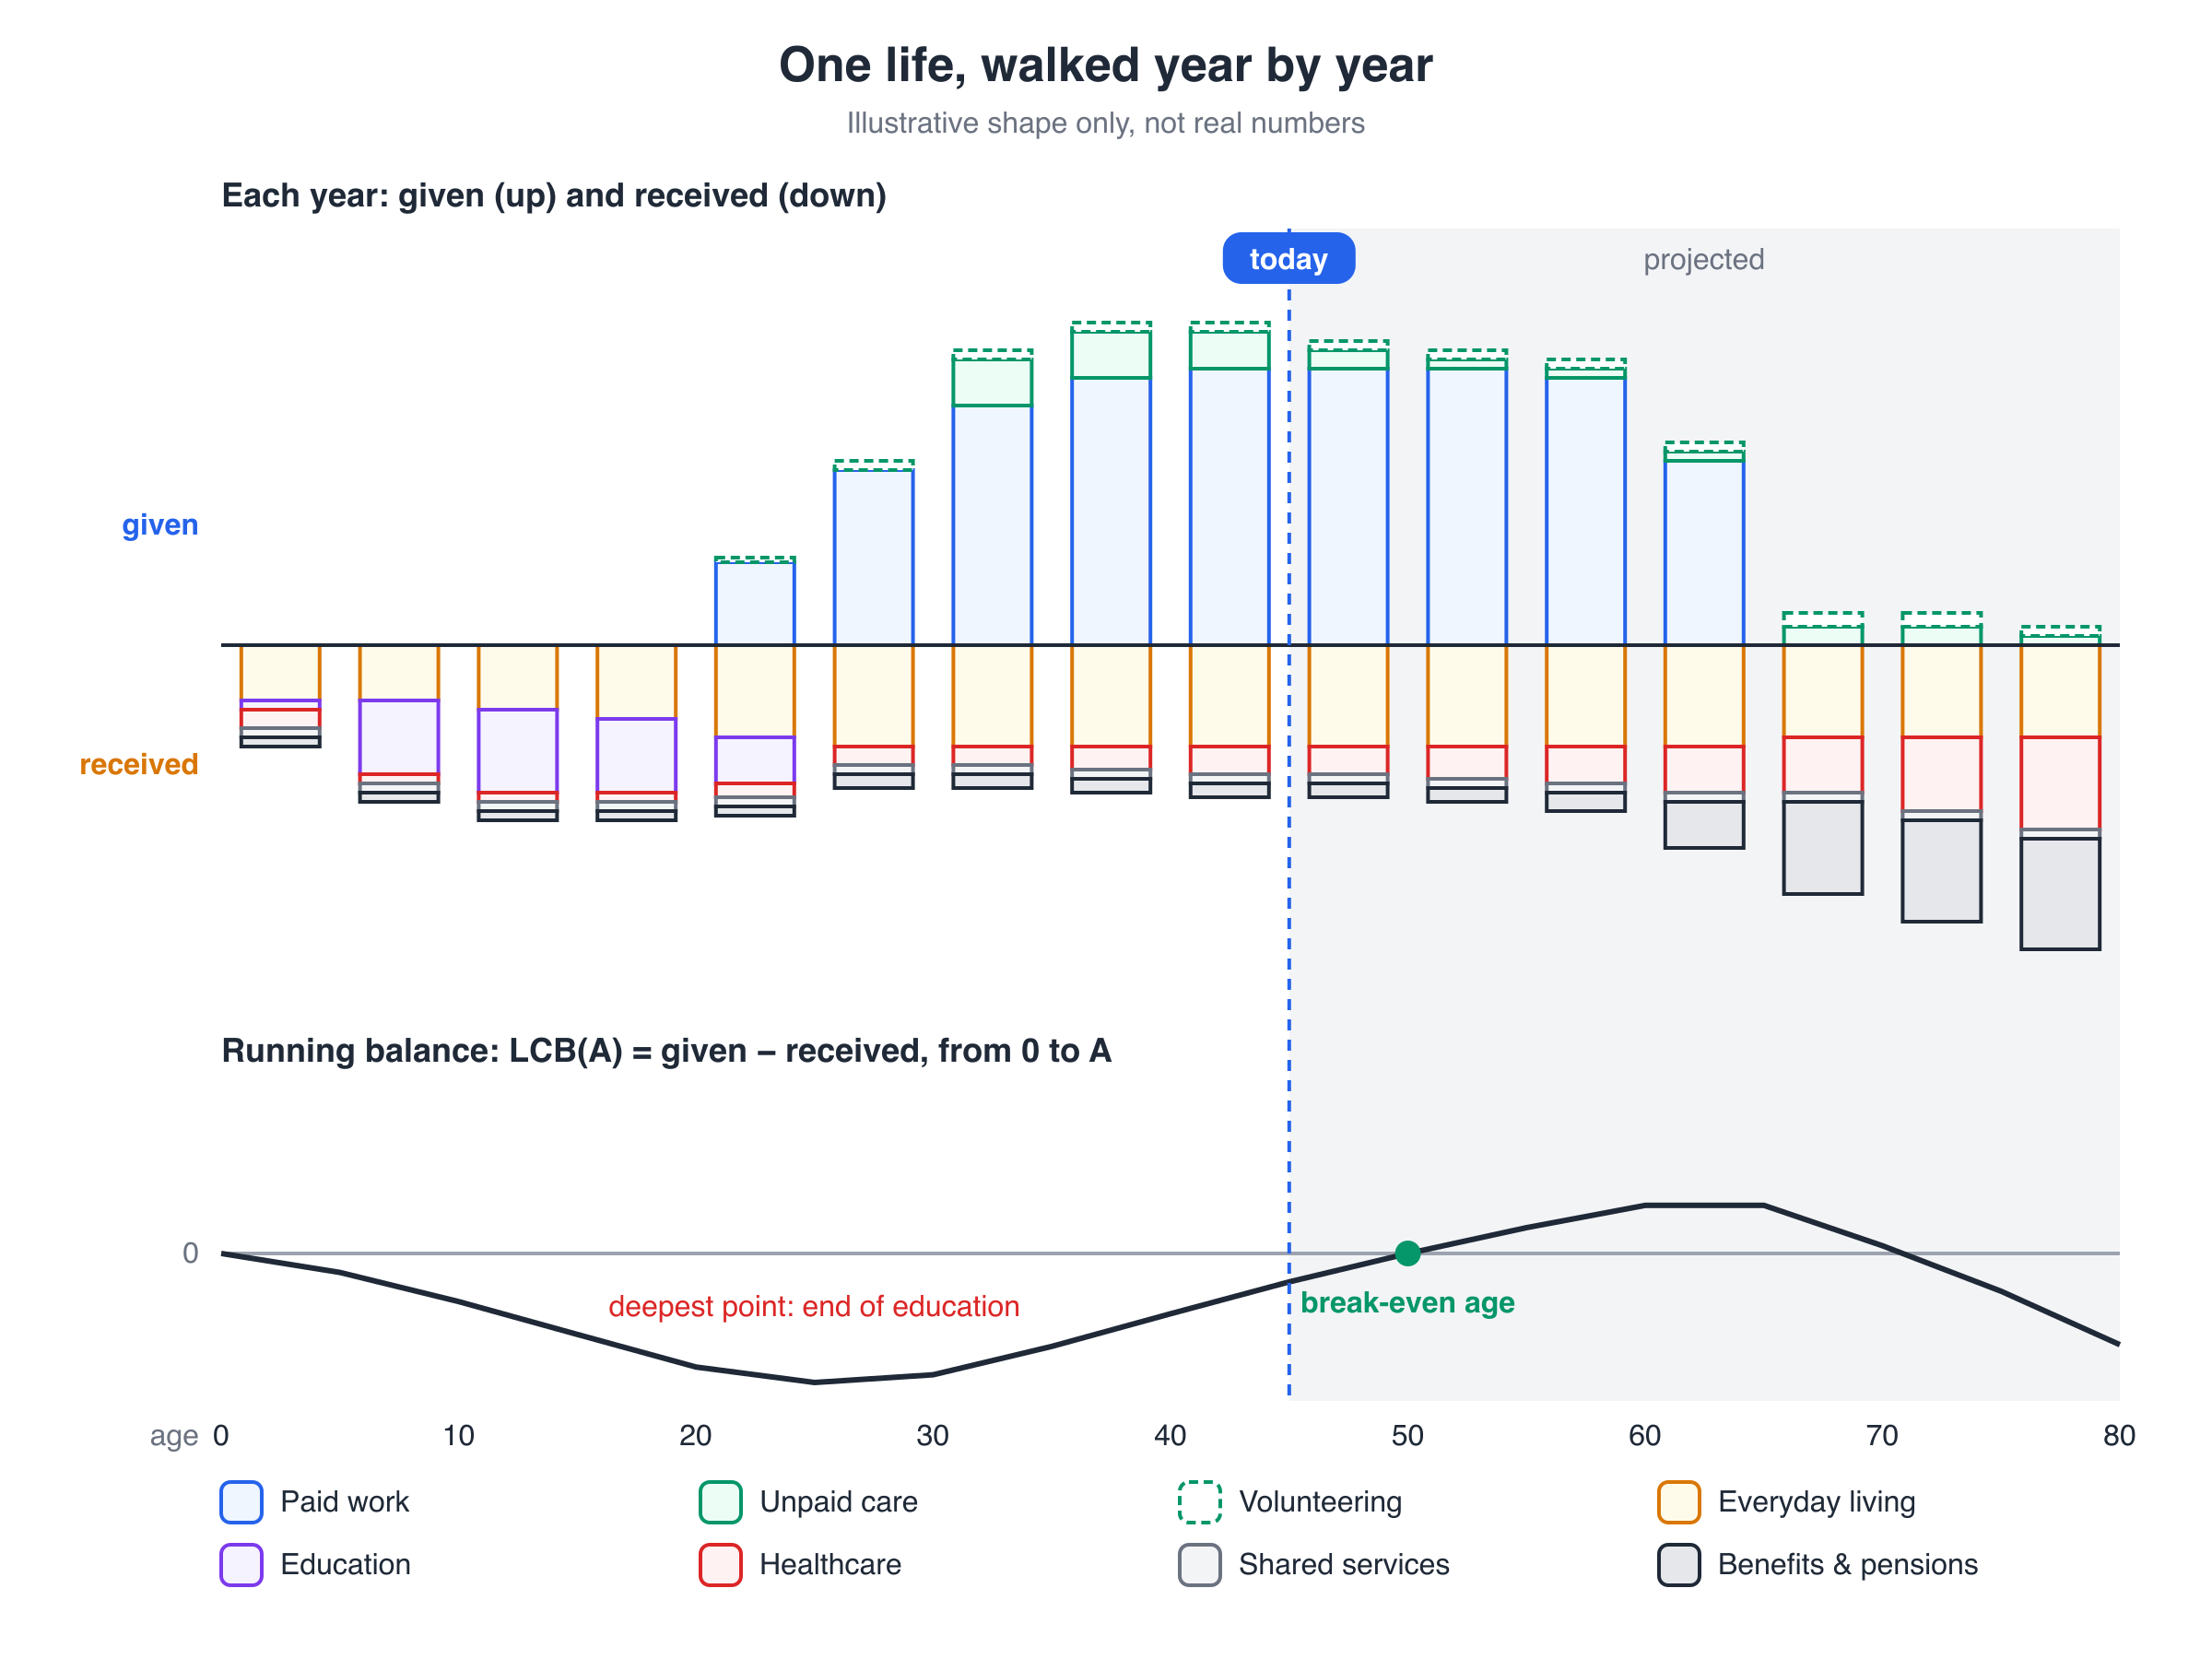
That shape is the most useful thing to understand about the tool. A negative balance at 25 is not a verdict. It is just the dip after years of school, before a working life has had time to happen. The results page puts it plainly: being short at that age is "entirely ordinary."
What counts on each side
| Received (consumption) | Given (contribution) |
|---|---|
| Everyday living: household spending, shaped by age, lifestyle, housing and transport | Paid work: the value your hours add to the economy |
| Education: spending per student at each stage, in the country where you studied it | Unpaid care: hours spent raising children or caring for adults |
| Healthcare: health spending per person, curved by age | Volunteering: hours given, priced at a replacement wage |
| Shared public services: policing, roads, environment, culture and so on | |
| Benefits and pensions: social protection, plus unemployment and housing support where they apply |
One detail matters a lot here. Paid work counts as value added, not as salary. The formula is roughly hours × output per hour × an occupation factor × the labour share. Labour share is the slice of output that goes to workers. Wages and taxes are just two ways of dividing up that same output, so adding either on top would count it twice. A dedicated test, test_double_counting.py, exists to fail loudly if that ever creeps back in.
How it works under the hood
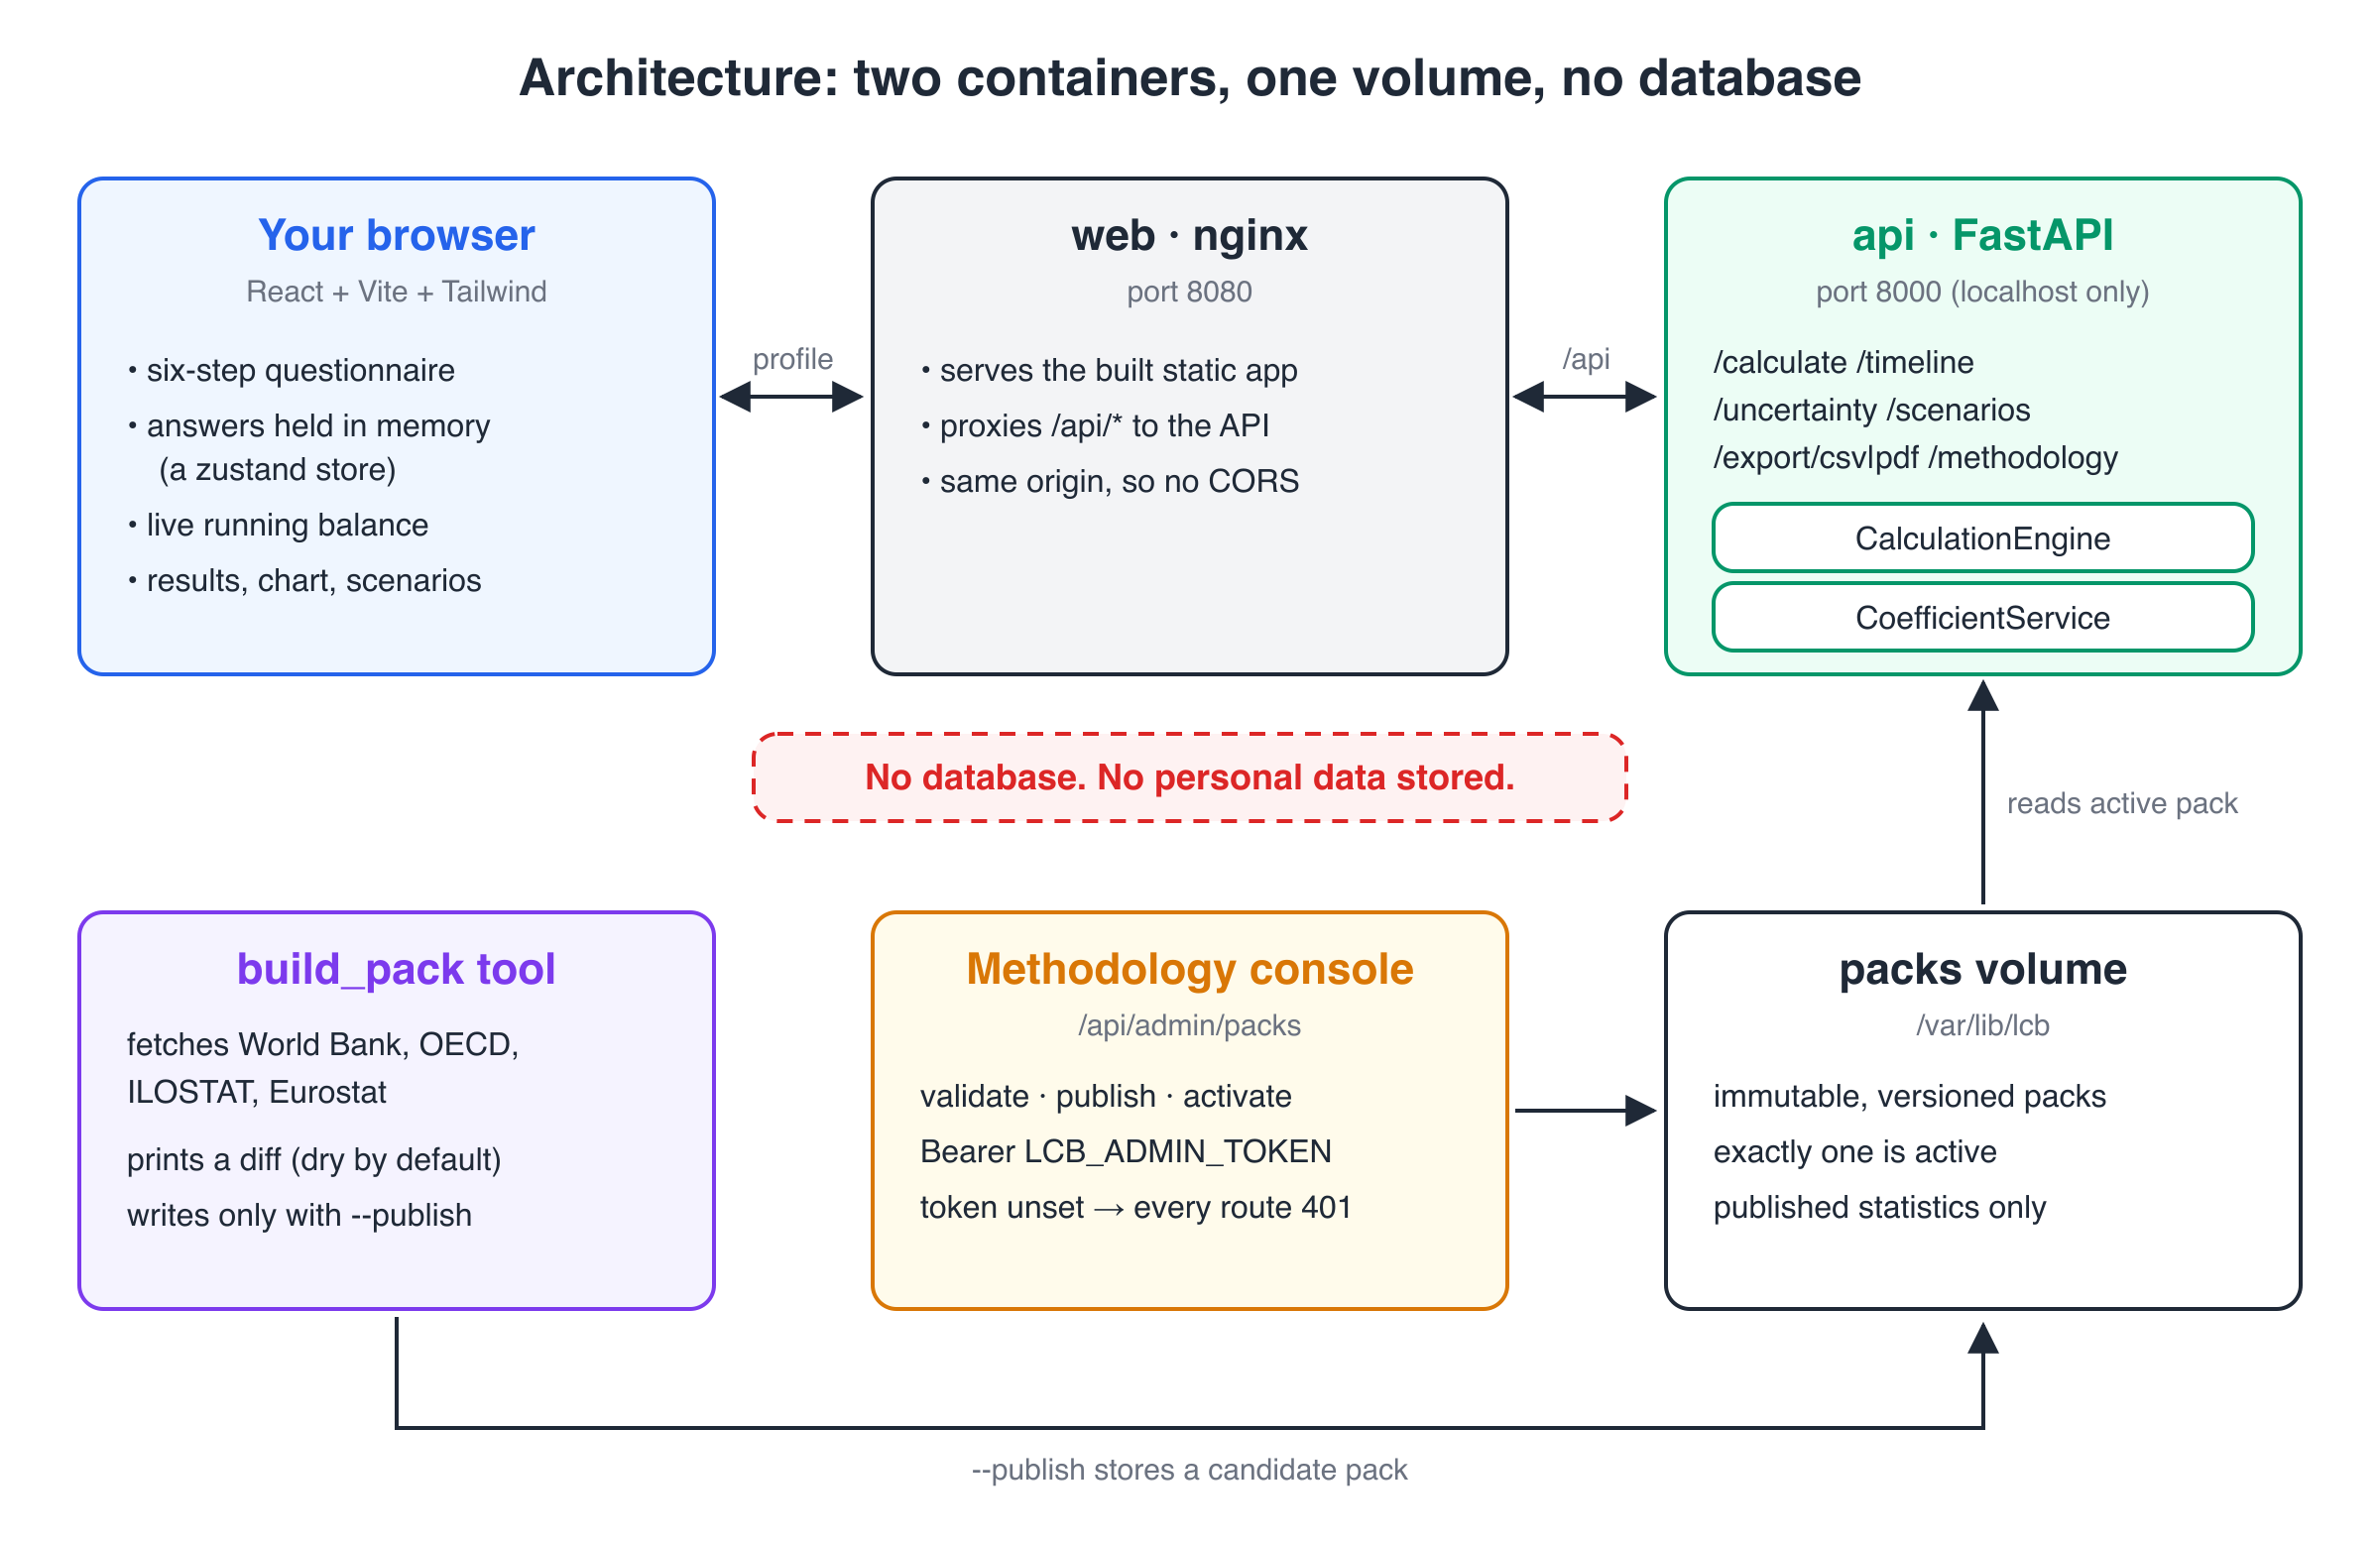
The whole thing runs as two Docker containers.
- The browser app (React, Vite, Tailwind). It shows the questionnaire, a running balance that updates with every answer, and the results. Your answers live in a small in-memory store (zustand) in the page itself.
- web, an nginx container on port 8080. It serves the built app and forwards anything under
/apito the calculator. Because the browser only ever talks to one address, there's no cross-origin setup to get wrong. - api, a FastAPI service on port 8000, published only on localhost. Inside, a
CalculationEnginewalks the timeline, and aCoefficientServicelooks up each statistic for a given country and year. - The packs volume. The only thing saved on disk is a set of versioned coefficient packs: published statistics, with nothing about any person.
Two side doors exist for whoever maintains the numbers. A build_pack tool fetches fresh statistics from the World Bank, the OECD, ILOSTAT and Eurostat. It prints a diff and writes nothing unless you pass --publish. A small methodology console under /api/admin/packs can validate, publish and activate packs, and it is locked unless an admin token is set.
Follow one answer through the system
Here is what happens when you change a single answer, say your occupation, in the Work step.
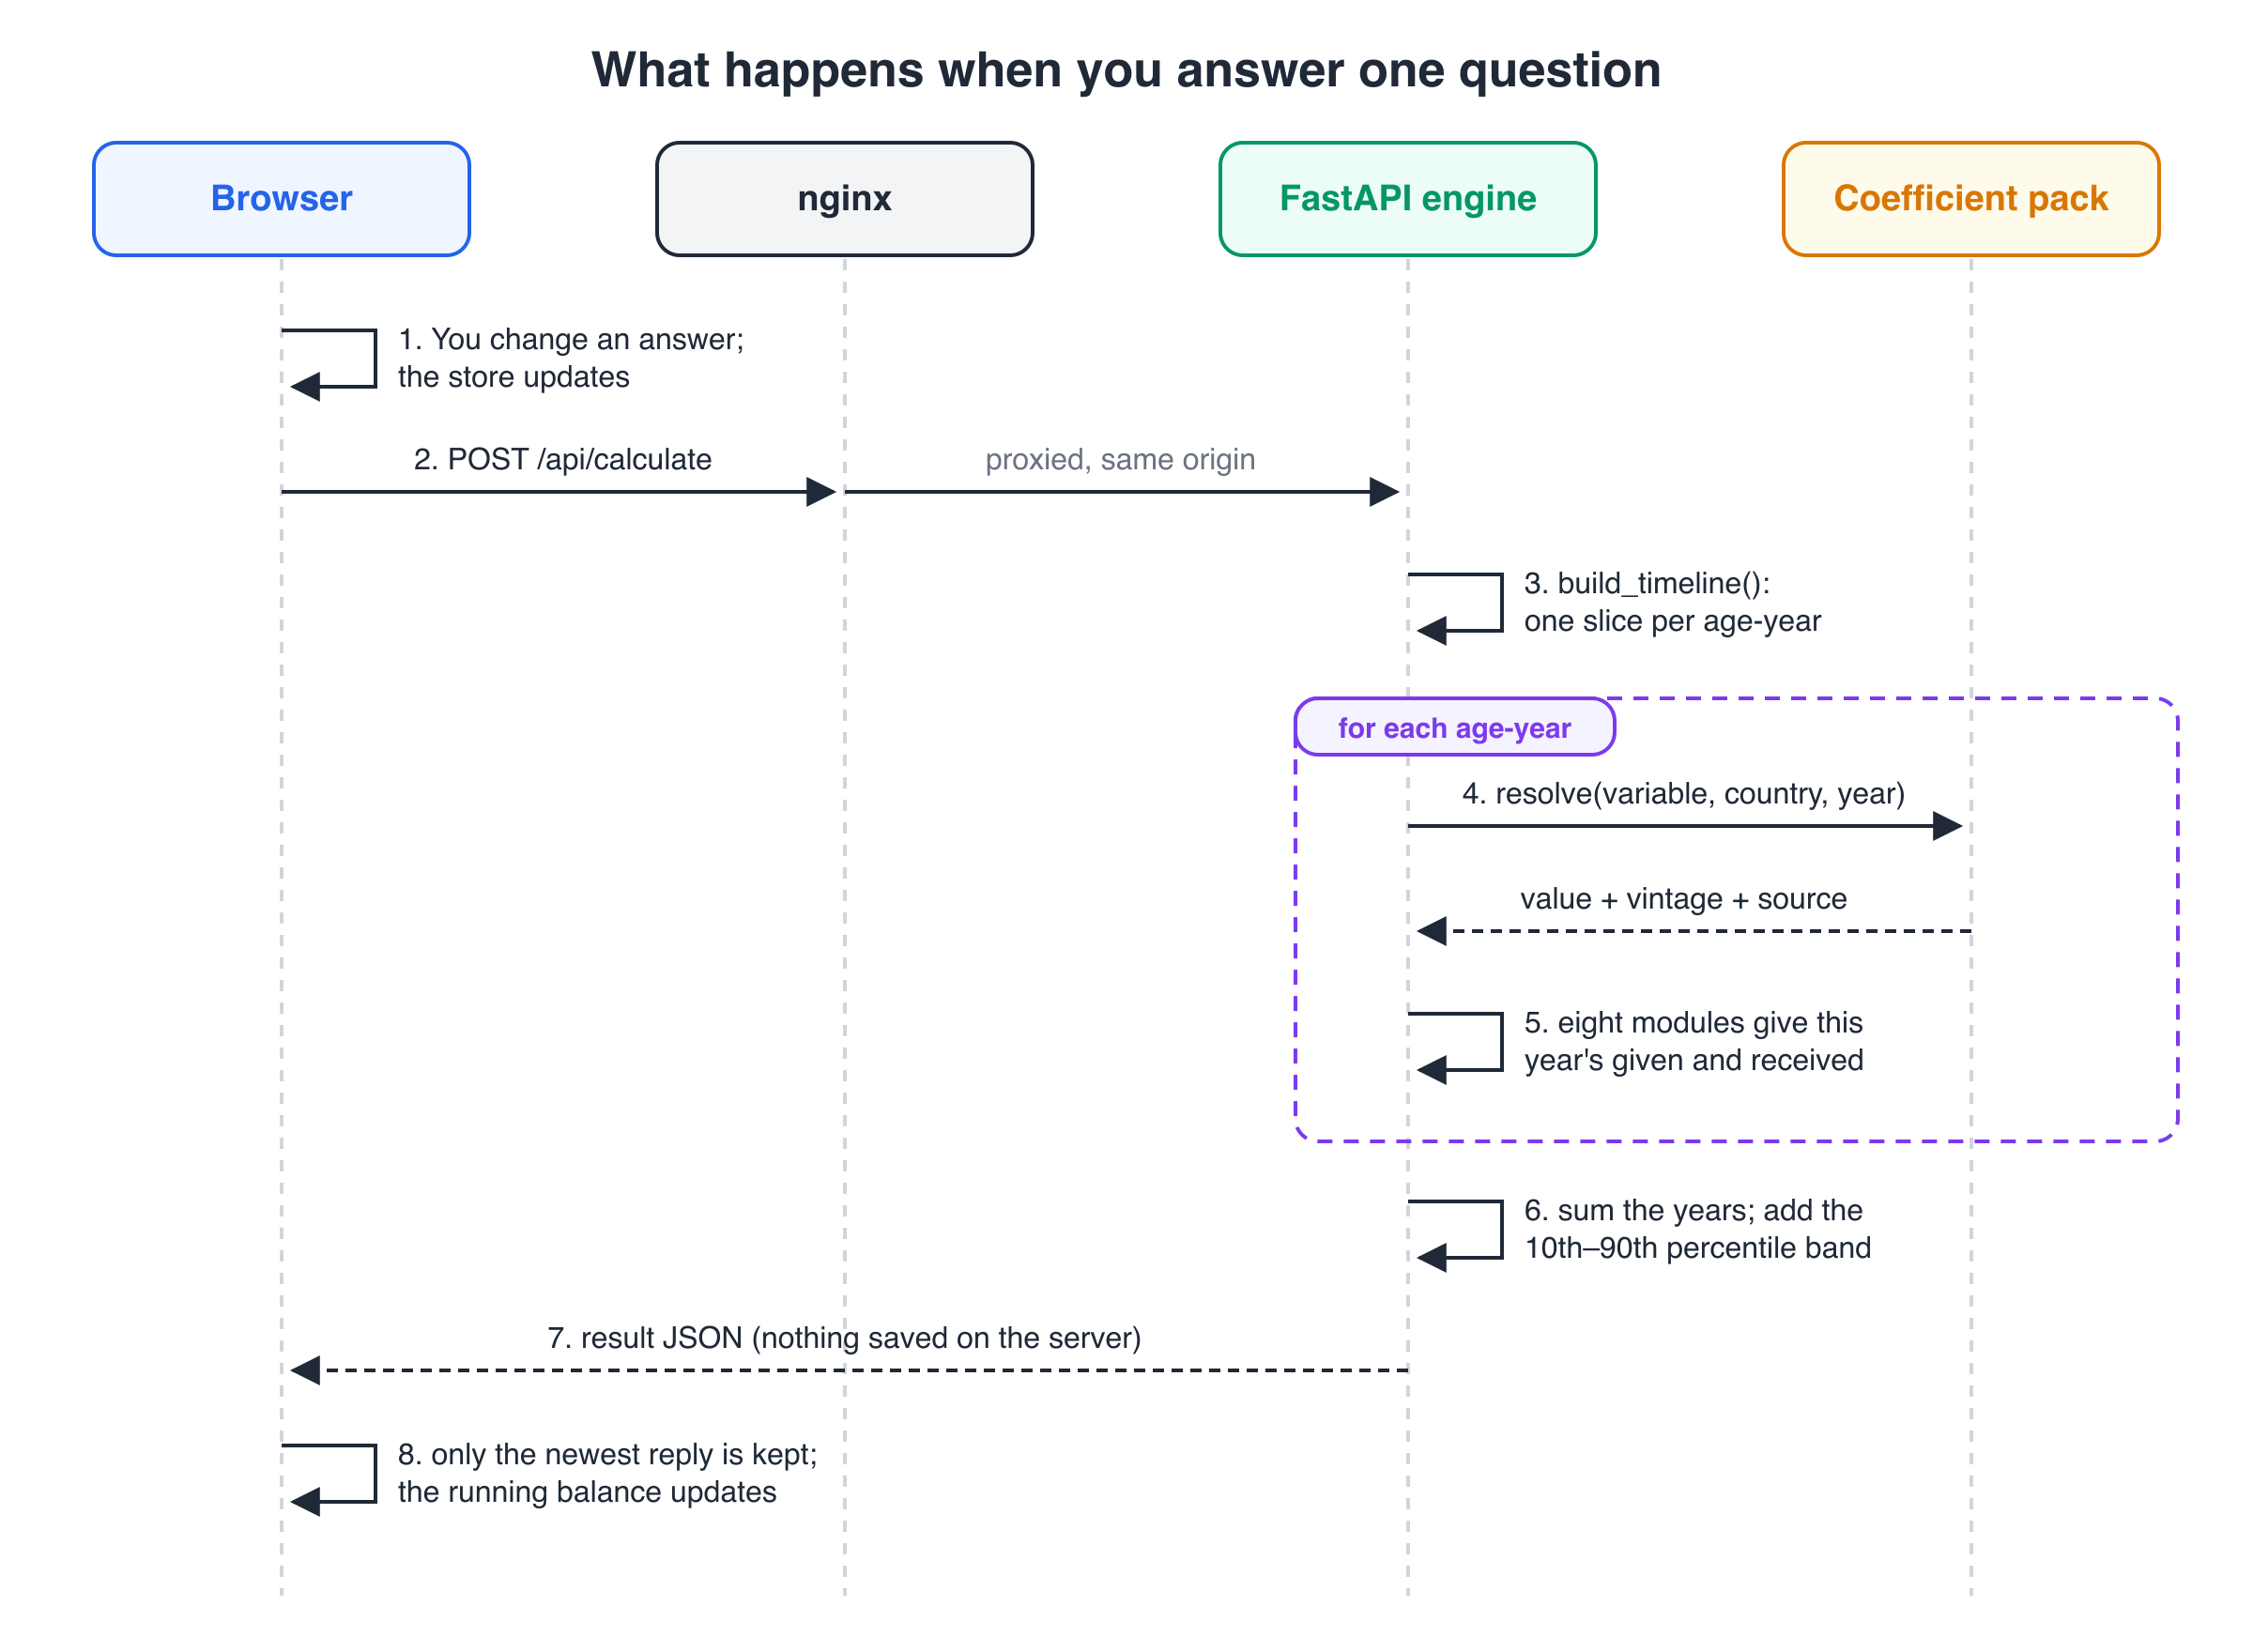
- The store updates. The page merges your change into the profile it holds in memory.
- It asks for a fresh estimate. The whole profile goes to
POST /api/calculate. Onlycurrent_ageandbirth_countryare required. Everything else falls back to a default. - The engine builds your timeline. Your answers become one slice per age-year: where you lived, whether you were studying, working or caring.
- Each year looks up its numbers. For every statistic it needs, the engine asks the pack for a value for that country in that year. Back comes the number, its source, and a label saying how solid it is.
- Eight modules run, and the year's "given" and "received" are added to running totals.
- The totals get an honest range. The headline figures come with a 10th to 90th percentile band.
- The result comes back as JSON. Nothing has been written anywhere on the server.
- The newest reply wins. If you type fast, an older, slower reply is thrown away by a simple counter, so the meter never jumps backwards.
Four design decisions worth stealing
1. The cheapest way to protect data is not to hold it
The choice: no database, no accounts, no server-side copy of anyone's answers. The questionnaire lives in the browser, and the API is a pure function: the same profile in always gives the same result out.
Why: the questions cover health, benefits, caring, migration and income. Put together, that is close to the most sensitive kind of personal data there is. Rather than build retention policies and access controls around it, I chose never to have it. A locker you never fill can't be broken into.
The trade-off: close the tab and your answers are gone. There's no "pick up where you left off" and no shareable link yet. The decision log notes that later phases might add opaque result snapshots that expire, but never profile data attached to a person.
2. Put every assumption in versioned data, not in code
The choice: every statistic the engine uses lives in a coefficient pack, a JSON file with a snapshot id. Fetched values carry the dataset id, the exact request URL and the retrieval date, down to individual cells. Packs are immutable: you can't overwrite a version, only publish a new one and switch to it. Rolling back just means activating the previous id.
Each country-year value also gets a vintage label that says how it was obtained:
| Label | Meaning | Effect on confidence |
|---|---|---|
L1_observed | A published value for that country and year | Full |
L2_interpolated | Filled in between two published values | One step lower |
L3_backcast | Reconstructed from that era's income level | Two steps lower |
L4_assumed | Borrowed from a peer country, scaled | Three steps lower |
Why: the uncertainty band widens on its own when the evidence is weaker. A 25-year-old's life sits mostly on recent, well-measured years. A 60-year-old's childhood sits on reconstructed ones, and the result shows it.
The trade-off: honesty is more work than it sounds. Beyond the per-country statistics there are roughly 220 further numbers, such as age curves, lifestyle multipliers and occupation factors, that nobody fetched. So GET /api/methodology marks every source credit as either fetched or typed to match, and names those hand-set blocks openly. As the decision log puts it, this does not close the gap. It makes it visible.
3. When a choice is unavoidable, make it a switch
The choice: some questions have no single right answer, so the tool exposes them rather than hiding them. How much of defence or debt interest should one extra resident "use"? The engine splits government spending into three tiers. Health, education and social protection are modelled per person. Congestible services, which have queues, roads and bin rounds behind them, are shared per person at half weight. Pure public goods like defence count at zero by default. Three presets (marginal, congestible_only, average) are available, and the results page shows what each one would say.
Unpaid care gets the same treatment, with three named ways to price an hour: a generalist replacement wage, a specialist one, or your own forgone earnings.
Why: these choices move the result, and quietly picking one would be dishonest. The default allocation in particular avoids handing everyone in a high-defence-spending country a fixed deficit that nothing they do could change.
The trade-off: more knobs mean more explaining, so the interface leans on short help texts.
4. Write tests that guard honesty, not just code
The choice: some of the most important tests check claims, not functions. One fails if the double count of wages comes back. One asserts that marking a question as "answered" only narrows the uncertainty band and never moves the estimate itself. Another records every pack value the engine actually touches and compares that list with what the methodology page says it uses. It fails in both directions.
Why: documentation drifts silently. Nobody writes anything false. Things just stop being true. A failing build is the only reviewer that never gets tired.
The trade-off: these tests are fiddly to write. Two of them exist purely to prove the guard itself can fail, because a check you've never seen fail looks exactly like one that can't.
A tool with a warning label
A number like this could be misused, and I'd rather say that up front than pretend otherwise. The welcome screen, the methodology page and the PDF export all carry the same sentence: this estimate must not be used for hiring, lending, insurance, immigration or any other decision about a person.
To be clear, that guard is a stated rule, not a technical lock. A calculator can't know who is using it. What the design can do is avoid making misuse easy. It holds no data to mine and no profiles to look up, and its defaults start neutral rather than flattering or punishing. The methodology page says it directly: illness, caring, study and unemployment all move the number, "and none of them makes a person a cost."

What was hard, and what I learned
Double counting hides in plain sight. My first version multiplied an occupation factor by an education premium. But the published degree premium already includes the fact that graduates hold more productive jobs. A graduate professional came out at 1.35 × 1.40 = 1.89 times the average worker. Now the occupation sets the level, and education only nudges it where it differs from what that job usually needs.
One wrong label, a 43% error. Going back in time, money figures get rescaled by real income per head. That is right for spending, but I had also applied it to hours worked. Since output already carried the ratio, it landed twice: a German working year in 1970 was valued at 43% of what it should have been. The fix was a single set, NOT_INCOME_SCALED. Finding it took asking what "borrow from a peer country" really meant.
The model penalised a carer for being educated. Imagine someone who spent twenty-two years as a full-time carer and holds a master's degree. The model counted the cost of the degree and never credited anything back, because the education premium only raises paid work, and they had none. I fixed the opportunity-cost convention so it works without a salary on record. I also added a second, unpriced account that reports hours of care, years and people raised, never converted into money. The deeper lesson is that the model only sees flows, not what people become. That is still open.
People move. "Where did you study?" used to cost the whole school chain in one country. Primary spending per student is roughly ten times higher in Germany than in India, so anyone who moved got a figure wrong by multiples. Now each stage is costed where you were actually living at the time, read straight off the residence timeline.
Six countries, each chosen to break something. Germany, the Netherlands, the UK, the US, India and Argentina. The UK sits outside Eurostat, the US has private-majority healthcare, India has wide data gaps, and one of Argentina's price converters stops in 2021. Similar countries would have agreed with each other and proved nothing.
Try it yourself
The quickest way is the live version at play.sanyal.net/life-balance. There is nothing to install and no sign-up, and nothing you enter is stored.
To run your own copy instead, you only need Docker. No database, no environment file, no accounts.
docker compose up --buildThen open http://localhost:8080 for the app. The interactive API docs are at http://localhost:8000/api/docs. You can also call the calculator directly. Only two fields are required:
curl -s -X POST localhost:8000/api/calculate \
  -H "Content-Type: application/json" \
  -d '{"profile": {"current_age": 38, "birth_country": "DE"}}'
To see every source and assumption behind a result:
curl -s localhost:8000/api/methodologyFor development, there are Make targets:
make up          # build and run everything
make test        # backend + frontend test suites
make dev-api     # FastAPI with reload on :8000
make dev-web     # Vite dev server on :5173
To open the methodology console, set a token first. Without one, every admin route returns 401, so the door is closed by default:
export LCB_ADMIN_TOKEN=$(openssl rand -hex 24)
docker compose up --build
curl -s -H "Authorization: Bearer $LCB_ADMIN_TOKEN" localhost:8000/api/admin/packs
What's next
The decision log keeps an honest "still open" list. In the order they will start to hurt:
- Pricing an hour of care. The generalist wage is now sourced, but which skill level fits care work is still a judgement call. The specialist multiplier needs an activity-to-occupation mapping before time-use survey data can replace it.
- The environmental shadow price. Footprints are reported in kilograms, cubic metres and square metres, with optional monetising via the US EPA social cost of carbon. Whether that is the right price is still open.
- A default discount rate. Discounting works as a scenario, but the choice between roughly 1% and 3% moves the break-even age by decades, so no default is picked yet.
- Bias review criteria. Deciding what "materially changes the result" means, before any data can influence that decision.
- Human capital as a stock. Letting the model see what people become, not just what flows through them.
Closing thought
This project began as a philosophical conversation with my wife and a few very close friends. What do we owe to society? Have we done our share for the environment and for the people around us, or are we, honestly, net consumers? All of us come from different backgrounds, with different educations and different paths through life, and the question turned into one of the most engaging conversations we've had. Lifetime Contribution Balance was born from that evening.
It is not an exact calculation, and it never will be. But whatever the numbers say for any one person, my own sincere takeaway is this: most of us have taken more from society than we have given back to it so far. For me, that isn't a reason for guilt. It's a reason to keep giving.
If you try it, I'd love to hear what surprised you, or which assumption you'd argue with. Leave a comment below, and subscribe if you'd like the next build in your inbox.